Adding an ID. Resetting a navigation stack. Moving a calculation up one level. Isolating a tiny import.
Some of our biggest performance wins at Handoff came from changes like these. Obvious in hindsight. Harder to spot when each piece of code looks reasonable on its own.
Here are six memorable ones from the last year across our backend and our universal React Native app. Plus a TypeScript DX bonus.
Count the calculations, not just the queries
An estimate breaks a construction job into materials and labor, with quantities and prices for each row. Several GraphQL fields recalculated the full breakdown for every row. At 400 rows, that meant about 2,000 calculations and 800,000 row iterations.
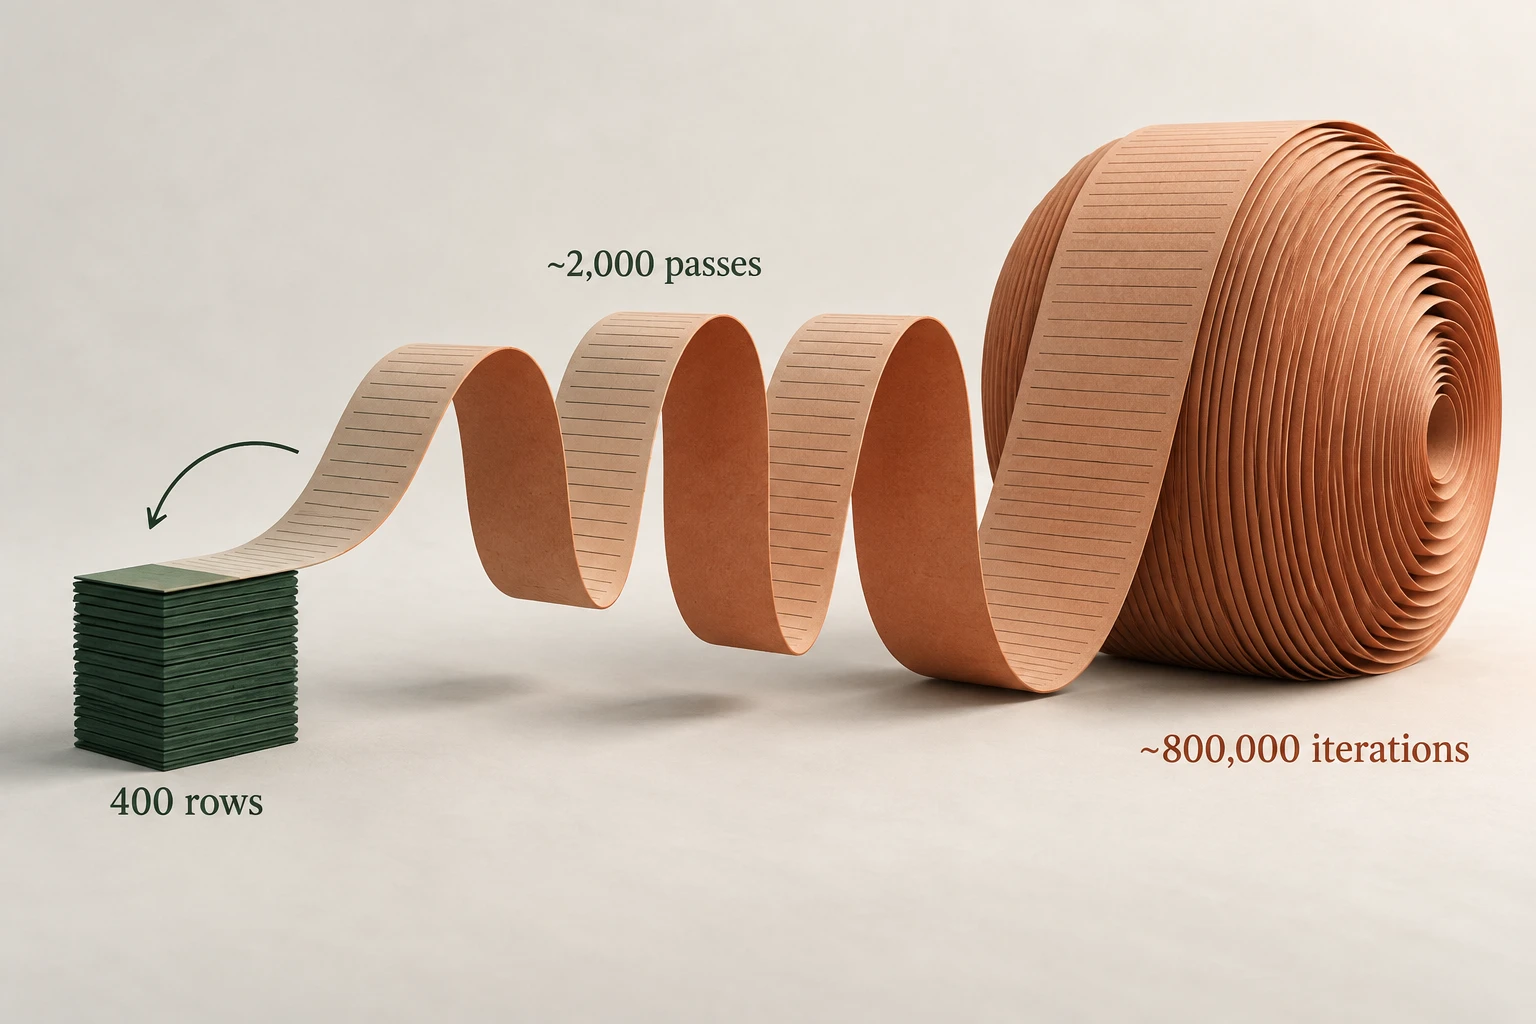
On small projects with 30–60 rows, this wasn't obvious. Full-house estimates with 300–400 rows exposed it: repeated calculations hammered the server's JS thread and slowed unrelated requests. That's the danger of quadratic work. Ten times the rows can mean a hundred times the work.
We calculated the estimate once, loaded the supporting data in batches, and reused the results for each row. Totals, rounding, and zero values still had to hold up.
Count calculations as well as database calls. Caching a query doesn't stop you from processing its result thousands of times. Neither does making the function async.
One missing ID, a waterfall of requests
We already had the data. But some GraphQL responses were missing an entity's id, so Apollo couldn't reliably connect them to what it had cached.

Auth, navigation, permissions, and billing would fetch again. One missing ID caused a cascade of work that shouldn't have happened.
We added IDs to queries and manual cache writes, alongside query and fetch-policy fixes. Fewer unnecessary requests, less repeated work, and less pressure on the server.
Check the lint rules for your tools. GraphQL ESLint's require-selections catches missing id selections when the type has one. We enabled it. A simple lint error would have saved a lot of this headache.
Native stacking didn't translate well to web
During longer web sessions, everything started to crawl. On mobile, stacking screens works naturally: you open a screen, then go back, popping it off the stack.

Our web app used the same React Navigation stack, but people moved between pages through the sidebar. Those links used router.push(). Even going home added a page instead of clearing the old stack. Screens and their observers kept accumulating. Freezing reduced rendering, but didn't release those subscriptions.
We had to clear the stack explicitly when a main root page became visible. Removing those trees released their observers. One local comparison dropped from 3,671 query observers to 298, with the same 105 cache objects.
The native pattern was useful, but our web navigation needed different cleanup.
Render less, less often
A lot of React performance comes down to this: render less, less often. Only do the work the current interaction needs.

Our closed dialogs and bottom sheets kept their forms mounted, which preserved state. Even with React Compiler, those trees can still rerender when state or context changes, while nobody is using them. We used react-freeze to pause rendering without unmounting them: keep the state, resume before opening.
The UI already worked. This made it cheaper to keep around. That's often the game with React performance: give it less to do.
A small PostHog queue, a lot of JS work
PostHog's React Native storage was keeping 200 events, about 1.86 MB. Small enough. But adding one event could turn the whole cache into JSON again and write it to storage.

One new event, another copy of everything. During bursts, those copies piled up faster than writes finished. Profiling found 284 large strings accounting for roughly 1.06 GB.
We removed duplicate feature-flag events, cut the queue to 30, and kept only the latest copy waiting to be written. That didn't eliminate every JSON conversion, but it reduced the data being processed and the copies kept alive. The smaller queue also means losing older analytics events sooner when offline.
Follow what happens after an append. A small queue can still create a lot of work if every change rewrites the whole thing.
The dark side of DOM components
A single import can bring a whole chain of app code into a DOM bundle. Our editor needed a tiny underline helper. Importing it from a shared module pulled in GraphQL, telemetry, and their dependencies too.

Don't assume the bundler will strip everything you aren't using. Expo Atlas showed what actually got included. We isolated the helper and removed unnecessary use dom directives. Together, those changes reduced reported DOM bundle output from 27.6 MB to 1.7 MB.
Keep these imports small and self-contained. Sometimes duplicating a few lines is better than dragging a much larger bundle along with them.
Bonus: 53 million fewer type instantiations
We had already moved to Go-based TypeScript, and a cold check still took 79 seconds. Microsoft's TypeScript 7 benchmarks had VS Code building in about 10 seconds. If VS Code could do that, why was our Node server taking over a minute just to check types? That was worth digging into.

Our Prisma types described configurations we didn't use. Narrowing them in just a few files brought that same check down to 13 seconds, with 53 million fewer type instantiations and identical JavaScript. With a warm cache, small edits can type-check in about 2 seconds.
That's a big win for AI coding too. Less waiting between editing and checking means a much better feedback loop. Check --extendedDiagnostics before accepting slow checks as normal. Even a faster compiler benefits from less work.
Code examples and implementation notes
Count the calculations
async function resolveRows(estimate, rows) {
  const totals = await calculateEstimate(estimate.id);
  return rows.map((row) => ({
    ...row,
    precomputedTotal: totals.get(row.id),
  }));
}

function resolveTotal(row) {
  if (row.precomputedTotal != null) {
    return row.precomputedTotal; // Zero is valid too.
  }
  return calculateRowTotal(row); // Existing fallback.
}
The parent computes a result for each row and passes it down. The row resolver then reads that value instead of walking the estimate again. A DataLoader can save a database round trip while leaving all of that CPU work intact, so we had to fix both layers.
Here, totals is a map keyed by row ID. That matters too: replacing a repeated calculation with a repeated search through the entire result array can leave another quadratic loop behind. Build the lookup once, then read from it.
The null check is deliberate. A zero total must take the fast path, not fall through because it is falsy. We kept the fallback because rows also arrive through other queries and mutations. The precomputed values travel with this response; they are not a long-lived cache of totals that could go stale after an edit.
One missing ID
 fragment EstimateFragment on Estimate {
+  id
   name
} data: {
+ id: messageId,
message,
role,
},Apollo normally identifies an entity using its __typename and ID. A name alone is just a value inside a particular response; it does not give the cache a reliable identity to share across queries. Nested entities need their own identity too. Selecting the estimate ID does not identify its contact or organization.
Manual writes need the same care. We added the message ID to the data being written, so it matched what the fragment expected. When investigating this, check the query selection, the actual response, and any code that writes the same entity locally.
Then make the mistake harder to repeat. We enabled the GraphQL operations lint rules with access to our schema and a processor for queries embedded in TypeScript. Custom cache identity fields need matching lint rules. And an ID does not make an incomplete query complete: missing fields and fetch policies still need their own fixes.
Reset the stack, keep the context
// Once the target root is visible, read its active tab.
const root = state.routes[state.index];
const tabState = root.state;
const activeTab = tabState?.routes[tabState.index];

navigation.dispatch(CommonActions.reset({
  index: 0,
  routes: [{
    name: "(tabs)",
    state: {
      index: 0,
      routes: [{
        name: selectedTab,
        params: activeTab?.params,
      }],
    },
  }],
}));-navigation.navigate(route.name);
+navigation.navigate(route.name, route.params);The first reset removed the retained screens, but rebuilding a route from its name alone also discarded its parameters. A follow-up carried the active tab’s params into the replacement route. That kept the selected date, view, and filters while still releasing the old detail trees. For a root outside the tab navigator, we preserved the root route’s own params instead.
There were two places to fix. Cleanup had to preserve the destination state, and the navigation controls had to pass it back when revisiting a tab. Otherwise a sidebar or tab press could erase the params before cleanup even ran. On web, we reused only strings and arrays of strings from retained params, rather than copying nested navigation objects into the URL.
The reset still runs only when the intended root is actually visible. We also avoid repeated resets and cancel scheduled cleanup if focus changes. Detail-to-detail navigation keeps its normal stack. The goal is to release the expensive screen trees while keeping the small amount of state that makes returning to a page feel right.
Render less, less often
+<Freeze freeze={!panelOpen}>
   <RowPanelProvider>
     <BottomSheet onDismiss={handleDismiss}>
       <RowForm />
     </BottomSheet>
   </RowPanelProvider>
+</Freeze>function openPanel() {
setPanelOpen(true);
requestAnimationFrame(() => sheetRef.current?.present());
}
function handleDismiss() {
setPanelOpen(false);
}The boundary has to include the work you want to stop. Freezing the form alone still leaves its provider free to rerender, derive values, and notify consumers. We moved the boundary above both. The state that controls freezing stayed outside it, so opening the panel could wake the tree back up.
The ordering matters. We set the panel active before presenting it, then froze it from the dismissal callback. Freezing as soon as someone taps Close can catch the sheet halfway through its transition. The animation frame here is the scheduling used by our sheet integration; match this to the lifecycle of the component you use.
This preserves mounted React state, but it does not unsubscribe queries or stop timers. Check which work actually disappeared in the profiler. If the cost comes from a subscription that keeps running while hidden, a render boundary alone will not solve it.
The small PostHog queue
-maxQueueSize: 200,
+maxQueueSize: 30,const persist = createLatestWriter(writeToDisk);
persist(["event-a"]); // Starts writing
persist(["event-a", "event-b"]); // Waits
persist(["event-a", "event-b", "event-c"]); // Replaces waiting snapshot
// While the first write is still running:
// Disk writes: [a], then [a, b, c]While one write is running, keep only the newest snapshot waiting behind it. The intermediate copy can go because the latest snapshot already contains its events. Here, the calls overlap before the first write finishes; the helper writes that first snapshot, then the latest one.
This works because each value replaces the whole stored queue. For independent events that each need to be written, dropping the middle one would lose data. Our adapter applied this per storage key, so unrelated files could still write independently.
This bounds the write backlog. It does not remove the cost of creating each snapshot—that is why reducing duplicate events and shrinking the queue mattered too. The example uses arrays to make the behavior visible; PostHog passed our adapter strings it had already serialized.
The hidden weight of an import
-import { UNDERLINE } from "@/design-system/RichTextEditor/transformers";
+import type { TextFormatTransformer } from "@lexical/markdown";
+
+const UNDERLINE: TextFormatTransformer = {
+  format: ["underline"],
+  tag: "_",
+  type: "text-format",
+};
The useful thing to inspect is the path from the DOM entry to the unwanted dependency. Our underline transformer came from a shared module that also reached GraphQL and telemetry. The editor did not need those features, but its import graph still reached them. Keeping this tiny value local cut that path. The import type disappears from the JavaScript output.
We also checked where use dom was declared. It belongs at an intentional DOM boundary, not automatically on every module used by that component. We removed unnecessary directives from helpers and wrappers while keeping the real DOM entry intact.
Rebuild and inspect the output after each change. A smaller-looking source file says little about what ships. Our reported reduction includes both the isolated import and the removed boundaries; it is not a benchmark of this helper alone. For a larger shared helper, a small dependency-free module would be easier to maintain than copying it.
Less type work, faster checks
+type AppPrismaClientOptions = Prisma.PrismaClientOptions & {
+  log: Array<Prisma.LogLevel | Prisma.LogDefinition>;
+  omit?: never;
+};
+
-const client = new PrismaClient(options);
+const client = new PrismaClient<
+  AppPrismaClientOptions, "query", undefined
+>(options);
The expensive part was not the number of lines in the constructor. Prisma’s inferred type described global field-omission configurations we never used. When the client crossed transaction and extension boundaries, TypeScript had to expand and compare those model types.
The third constructor type argument, undefined, makes “no global omissions” explicit. omit?: never stops the options from contradicting that contract. Neither changes the runtime data. We applied the same contract to all five constructors and extension inputs, then narrowed a helper to the one model it used. The measured gain came from the combined change.
Check your generated Prisma definitions before copying the generic positions: the constructor and exported type alias use different ones. We added a compile-time check to catch the omission type widening again and compared emitted JavaScript. When measuring, keep the compiler and cold-cache settings fixed and inspect --extendedDiagnostics; otherwise a warm run can look like a type optimization.
The small wins add up
These are some of the most memorable ones. But performance is often death by a hundred paper cuts: a missing database index, another observer, another hidden render, another copy of the same data. Each looks harmless until they add up.
We chip away at it whenever we can. There are hundreds of smaller fixes across the team: one less render, a tighter query, less work on the JS thread. That steady work shapes how the product feels every day.
Not all fast software is good, but all good software is fast. Contractors should be able to get their work done without waiting on ours.
That's the standard we strive for at Handoff.